
The latest Bitcoin bear market has reached day 106 since it began on Jan 15, 2022 after trading sideways for most of 2021. The oft cited thesis that Bitcoin halving events drives the cryptocurrency markets remains intact. Anecdotally, the Bitcoin Miami conference had peak attendance and restaurateurs, Uber drivers, and other new investors all have a favorite coin.
Given the broad exuberance in the market contrasted with its technical weakness, it is unclear where new capital inflows will originate to drive prices higher. At the moment, it appears investors are chasing high-yield DeFi protocols to create income from their cryptocurrency portfolios, though with each successive Web3 exploit, that thesis appears hollow.
As with all bear markets, the market may feel emotionally more difficult, but it is during these times that fortunes are made for those who have the courage to execute their long-term strategy. Those with a long-term vision find buying opportunities while those who play the markets like a bad gambler and get caught chasing short-term profits could see their holdings decimated.
In the absence of the ability to predict such a volatile market with a high degree of accuracy, we should consider the multiple perspectives to contextualize where the cryptocurrency market is currently, where it may go, and make sure our strategy works for all potential outcomes.
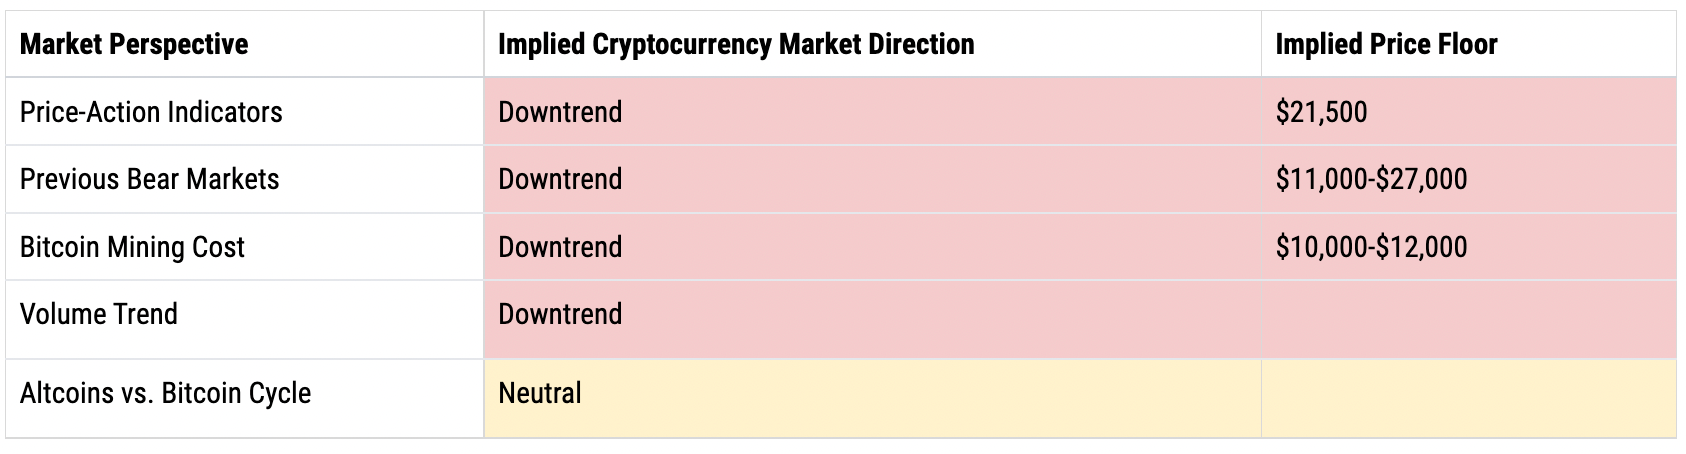
Price-Action Indicators
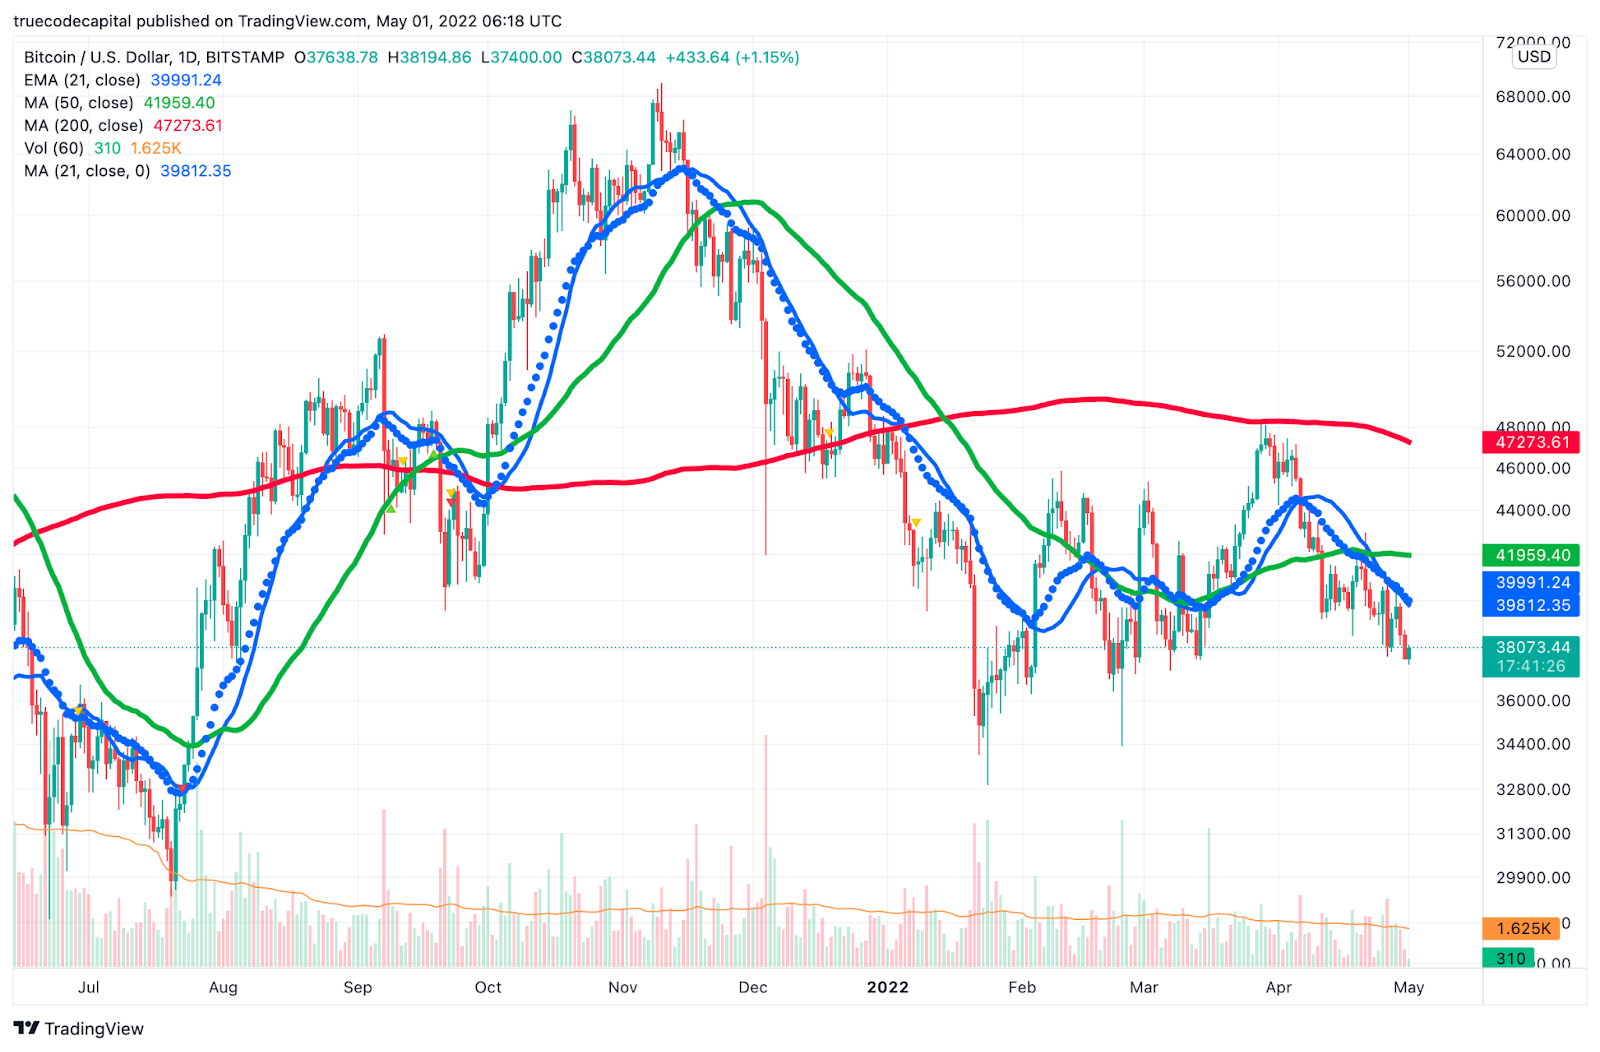
The 50-day moving average is well below the 200-day moving average and now the 20-day moving average has crossed below the 50-day moving average. All negative signs for those hoping for a return to the all-time highs of Fall 2021.
Telltale signs of a crypto bear market:
- Death Cross: 50-day simple moving average below the 200-day simple moving average
- Price has retested and been rejected by the 200-day simple moving average
- 200-day simple moving average is trending downward
Price Action Market Floor
Whenever a market enters a downtrend, investors all have the same question: where will the bottom be? It is impossible to predict the future, but we can review the previous bear markets and see what the range of possibilities are to inform our investment decisions.
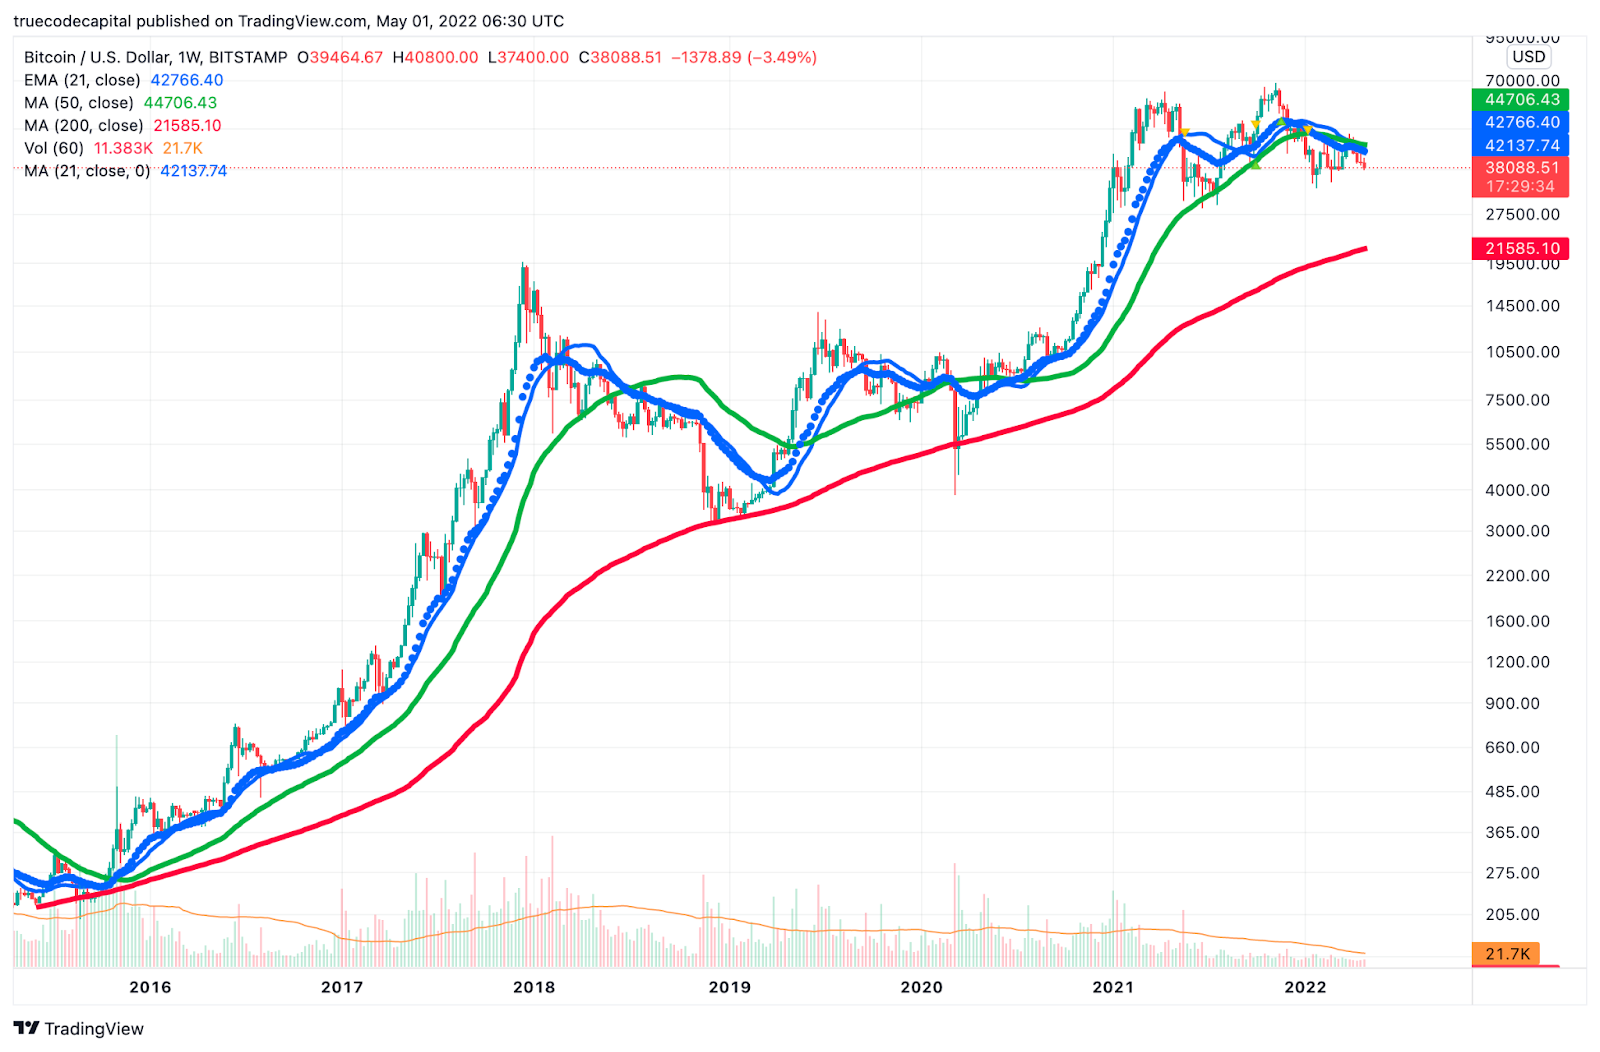
One form of analysis is to review the long-term price action to see where the asset has historically found support. Because the market has crashed below the common daily moving averages, we zoom out to the weekly chart to look for answers. Over the long-term, the 200-week moving average has been a reliable support in the past with price dipping under the 200-week moving average only a few weeks since trading data began being tracked for Bitcoin.
From this perspective, there may be more pain ahead as the present 200-week moving average is at around $21,500 for a nearly 50% breakdown to the downside. Investors may watch the 200-week moving average to see if it keeps increasing to the intersection of the 20-week and 50-week. If so, the market could build a base of support in that region, then become more constructive. However if price continues to find overhead resistance from the 20-week and 50-week moving averages, continued downward pressure.
Previous Bear Markets
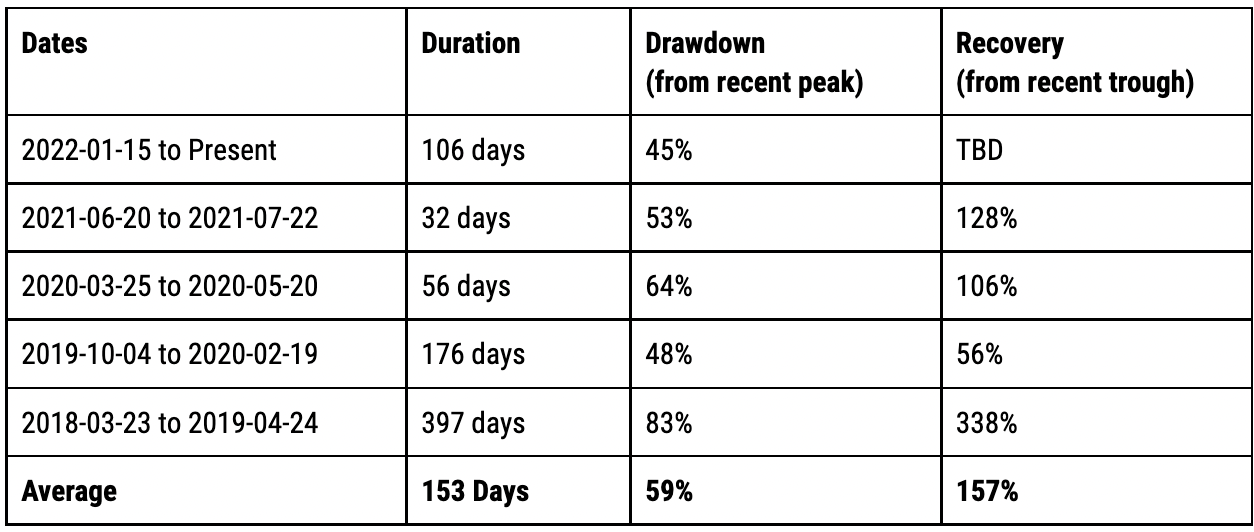
Cryptocurrency investors are no strangers to bear markets. They happen more frequently than in the traditional financial markets which is congruent with the idea of the market operating at higher velocity. While bear markets are unpleasant, we are lucky to have so many data points to draw from to gain insight for how this bear market may behave.
The worst case from recent history is the famous 397 day bear market in 2018-2019 where the market lost over 83% of its value. Today’s 45% drawdown is muted by comparison. If a similar drawdown were to occur in 2022-2023, the price floor could reach around $11,000, which is consistent with the fundamental viewpoint that Bitcoin mining cost provides support.
However, the current drawdown of 45% is nearing the bear market average of 59%, which would imply a bottom of around $27,000. So as stated above, if price can find support in the cluster near the 20-day and 50-day moving averages for a long enough period of time, it is possible the market may build an area of support and shift into a more constructive pattern.
Bitcoin Mining – Cost to Produce
It is useful to calculate the cost to mine one Bitcoin as one model for valuing Bitcoin. During market downtrends, the mining price floor provides support due to the hashrate difficulty adjustment that occurs as part of the protocol when miners become unprofitable and cease operations.
With today’s Antminer S19 Pro, it would take approximately 70 miners to produce one Bitcoin per month. Those miners would cost about $70,000 in capital expenditure for the mining equipment alone, plus facilities and installation costs. If we assume the miners are depreciated over 36 months, we can add $1,950 per month for mining equipment. Assuming a good rate for electricity of $0.06 per KWHr, it would cost around $9,800.00 to power the miners and produce one Bitcoin per month.
Given today’s market price of $39,600, that puts the spot price at 3.3 times the market floor of around $12,000.
Altcoins vs. Bitcoin
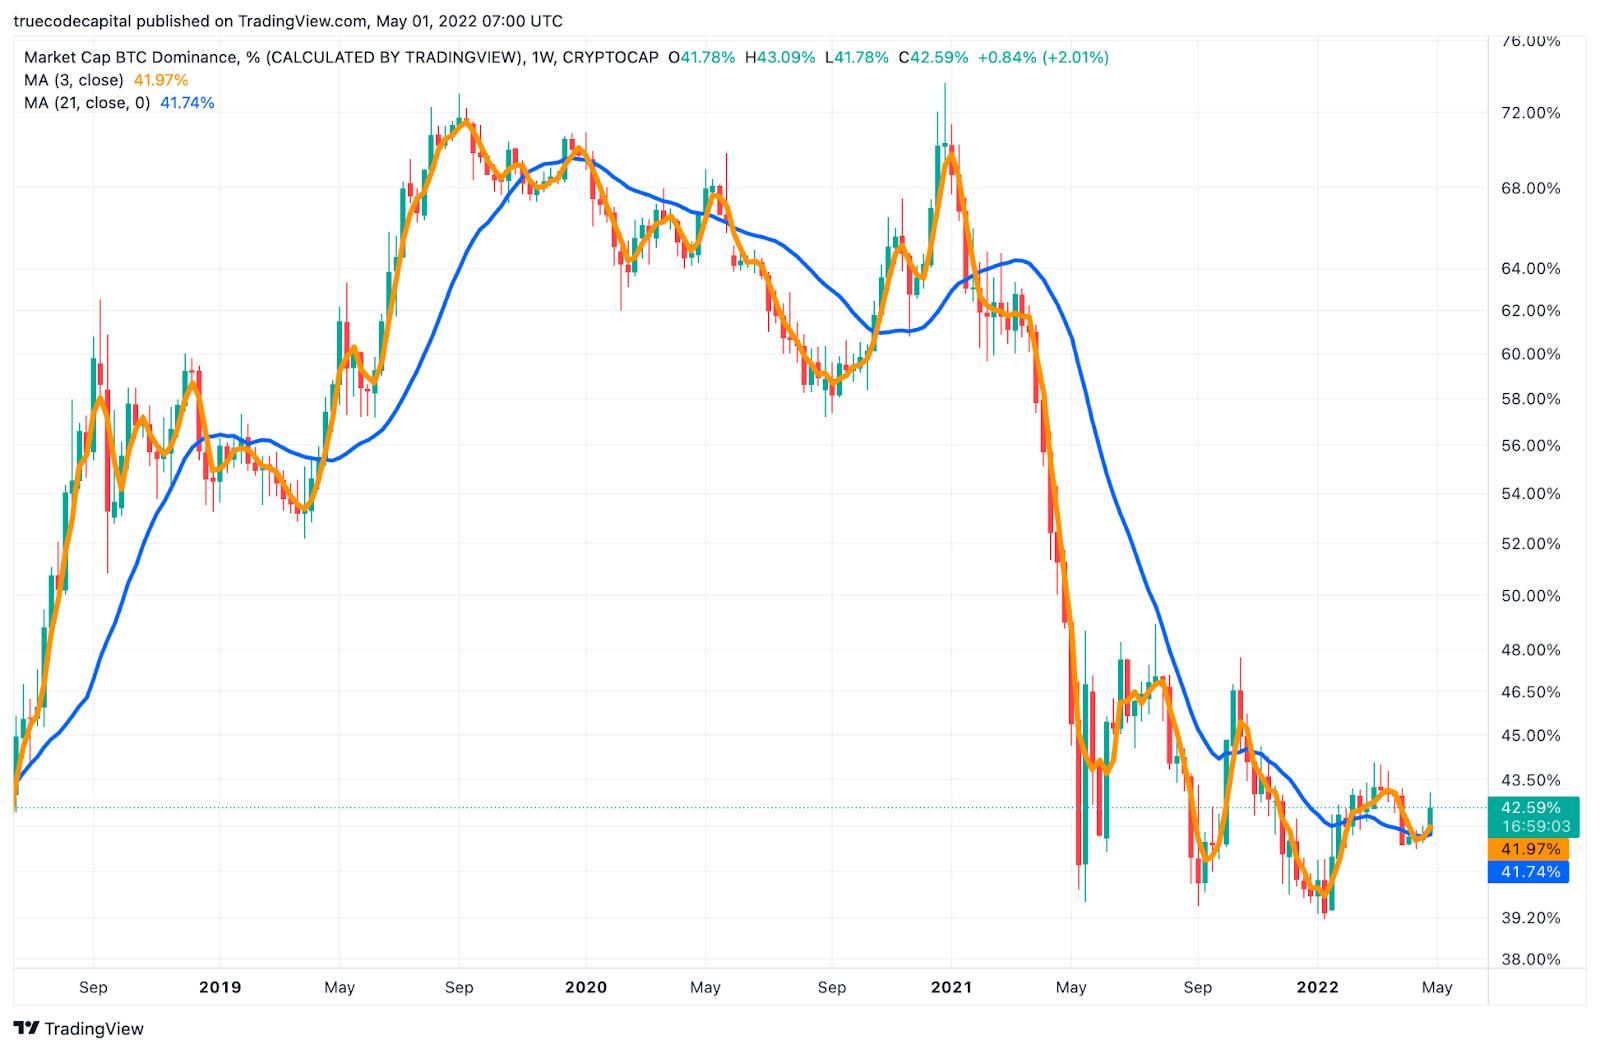
Bitcoin’s market dominance remains around 43%, where it has been since around July 2021. Historically, the decrease in Bitcoin dominance is associated with a crypto bull market because altcoins, now DeFi and NFTs are becoming more prevalent. During a protracted downtrend, investors frequently pull back from more speculative investments and treat Bitcoin as their safe harbor asset, which drives Bitcoin market dominance higher. During the last long-term bear market, Bitcoin dominance hovered around 60-70% for several years before the latest bull market spurred investment in altcoins, DeFi, and NFTs.
A spike in Bitcoin market dominance has not occurred yet, so from this perspective, investors are writ large not believing the present bear market will last. If we see Bitcoin’s market dominance move markedly higher, it would be another data point supporting the thesis of tougher trading ahead.
GENERAL DISCLAIMER
This presentation is not an offer to sell securities of any investment fund or a solicitation of offers to buy any such securities. Securities of TrueCode Capital Crypto Momentum Fund LP (the “Fund”) managed by TrueCode Capital LLC (the “General Partner”) are offered to selected investors only by means of a complete offering memorandum and related subscription materials which contain significant additional information about the terms of an investment in the Fund (such documents, the “Offering Documents”). Any decision to invest must be based solely upon the information set forth in the Offering Documents, regardless of any information investors may have been otherwise furnished, including this presentation.
The information in this presentation was prepared by the General Partner and is believed by the General Partner to be reliable and has been obtained from public sources believed to be reliable. General Partner makes no representation as to the accuracy or completeness of such information. Opinions, estimates and projections in this presentation constitute the current judgment of the General Partner and are subject to change without notice. Any projections, forecasts and estimates contained in this presentation are necessarily speculative in nature and are based upon certain assumptions. It can be expected that some or all of such assumptions will not materialize or will vary significantly from actual results. Accordingly, any projections are only estimates and actual results will differ and may vary substantially from the projections or estimates shown. This presentation is not intended as a recommendation to purchase or sell any commodity or security. The General Partner has no obligation to update, modify or amend this presentation or to otherwise notify a reader thereof in the event that any matter stated herein, or any opinion, project on, forecast or estimate set forth herein, changes or subsequently becomes inaccurate.
Disclosure #1:
Certain scenarios described herein are for illustrative purposes only and the assets described are not actual assets held by the Fund. These scenarios show the Principal’s investment in the Incubator Account. Inclusion of such scenarios is not intended as a recommendation to purchase or sell any assets and performance of the Incubator Account in these scenarios does not guarantee that the Fund will experience similar investment results or earn any money whatsoever.
Disclosure #2:
Any projections, forecasts and estimates contained in this document are necessarily speculative in nature and are based upon certain assumptions. In addition, matters they describe are subject to known (and unknown) risks, uncertainties and other unpredictable factors, many of which are beyond the Fund’s control. No representations or warranties are made as to the accuracy of such forward-looking statements. It can be expected that some or all of such forward-looking assumptions will not materialize or will vary significantly from actual results. Accordingly, any projections are only estimates and actual results will differ and may vary substantially from the projections or estimates shown.
Disclosure #3:
The graphs, charts and other visual aids are provided for informational purposes only. None of these graphs, charts or visual aids can and of themselves be used to make investment decisions. No representation is made that these will assist any person in making investment decisions and no graph, chart or other visual aid can capture all factors and variables required in making such decisions.
Disclosure #4:
The summary provided herein of the Fund’s terms and conditions does not purport to be complete. The Fund’s Memorandum should be read in its entirety prior to an investment in the Fund.